Dashboard Overview
Looking at the screenshot, let me provide an accurate description of the Pidima dashboard:
Dashboard Overview
The Pidima dashboard is your command center, providing real-time insights into your documentation and testing progress.
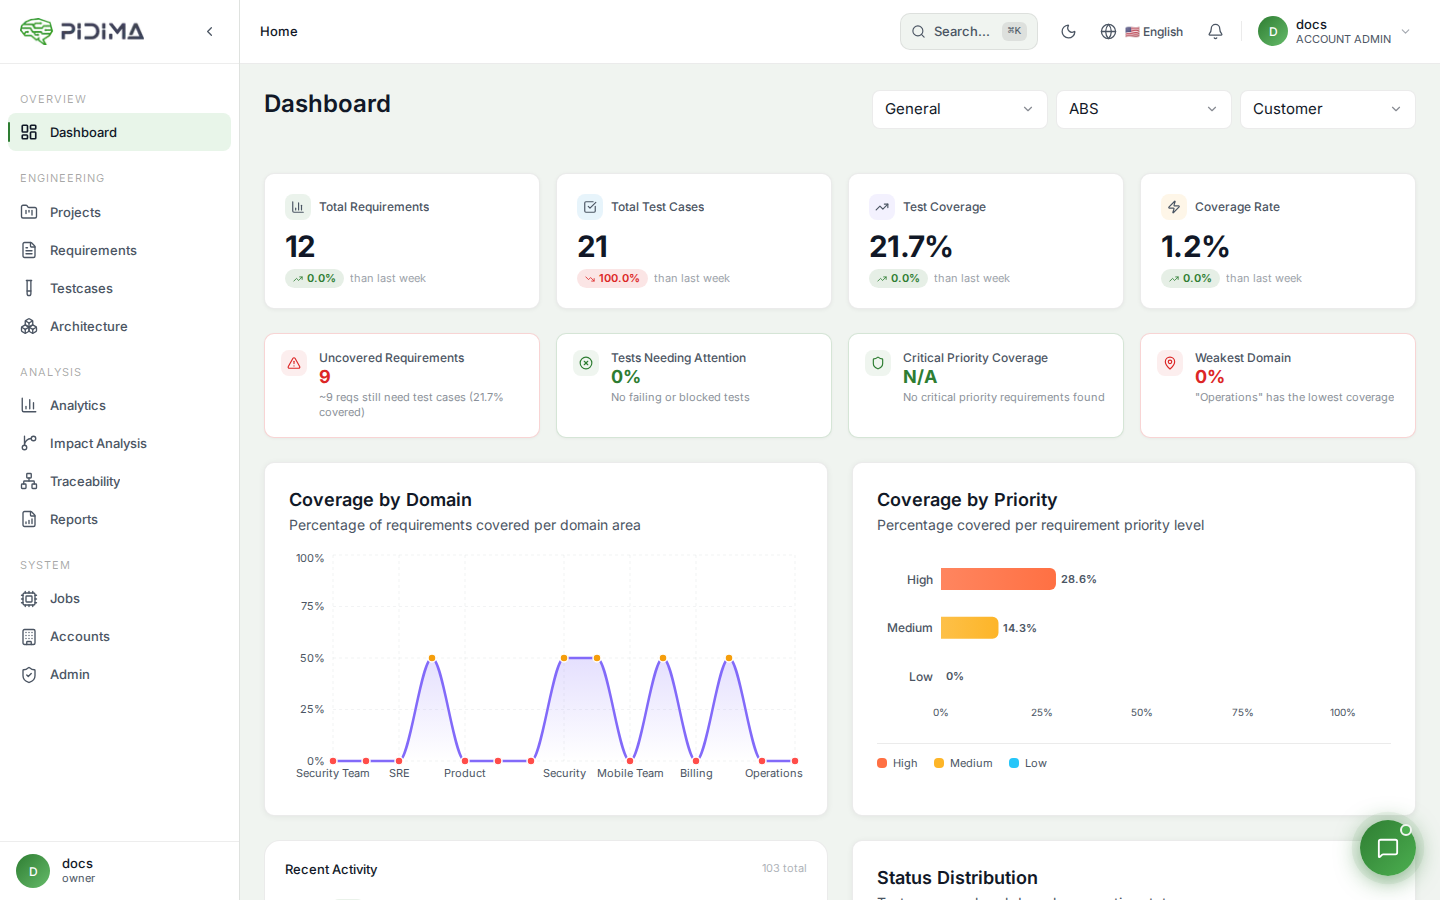
Key Metrics
The dashboard displays four primary metric cards at the top:
Total Requirements
Shows the complete count of requirements across selected projects with week-over-week percentage change. The metric tracks your requirement inventory growth.
Total Testcases
Displays the total number of test cases in your projects with trending data showing weekly progress.
Coverage Percent
Shows the overall test coverage percentage, indicating what portion of your requirements have associated test cases.
Coverage Rate
Displays the coverage ratio as a decimal value, providing another view of your testing completeness.
Interactive Charts
Requirements by Domain (Left Panel)
Lists functional domains within your project:
- Profile Management
- Configuration
- Clock & Timing
- Memory
Each domain shows its individual coverage percentage, with a "Read More" option to expand details.
Testcases By Status (Center Panel)
A donut chart visualizing test case status distribution:
- Under Review (Blue): Test cases pending approval
- Accepted (Green): Approved test cases
The center displays the acceptance percentage.
Requirements by Priority (Right Panel)
Shows coverage percentages organized by requirement priority levels:
- Critical: Highest priority requirements
- High: High priority items
- Medium: Standard priority requirements
- Low: Lower priority items
Each level displays both a trend percentage and current coverage rate.
Recent Activity
The activity table tracks all system changes with:
- Date: Timestamp of the action
- User: Who performed the action
- Description: Details of what was created/modified (e.g., "CREATED TESTCASE TC_TMB_REQ-ALS-012_001")
- Project: Associated project name
- Pagination: Navigate through activity history
Dashboard Filters
Customize your view with dropdown filters at the top:
- Account: Filter by specific accounts (shows "All Accounts" by default)
- Project: Focus on individual projects (shows "All Projects" by default)
- Level: Filter by hierarchy levels within projects
The filters allow you to drill down into specific areas of your organization for targeted analysis.